Checking CPU Usage in InterWorx
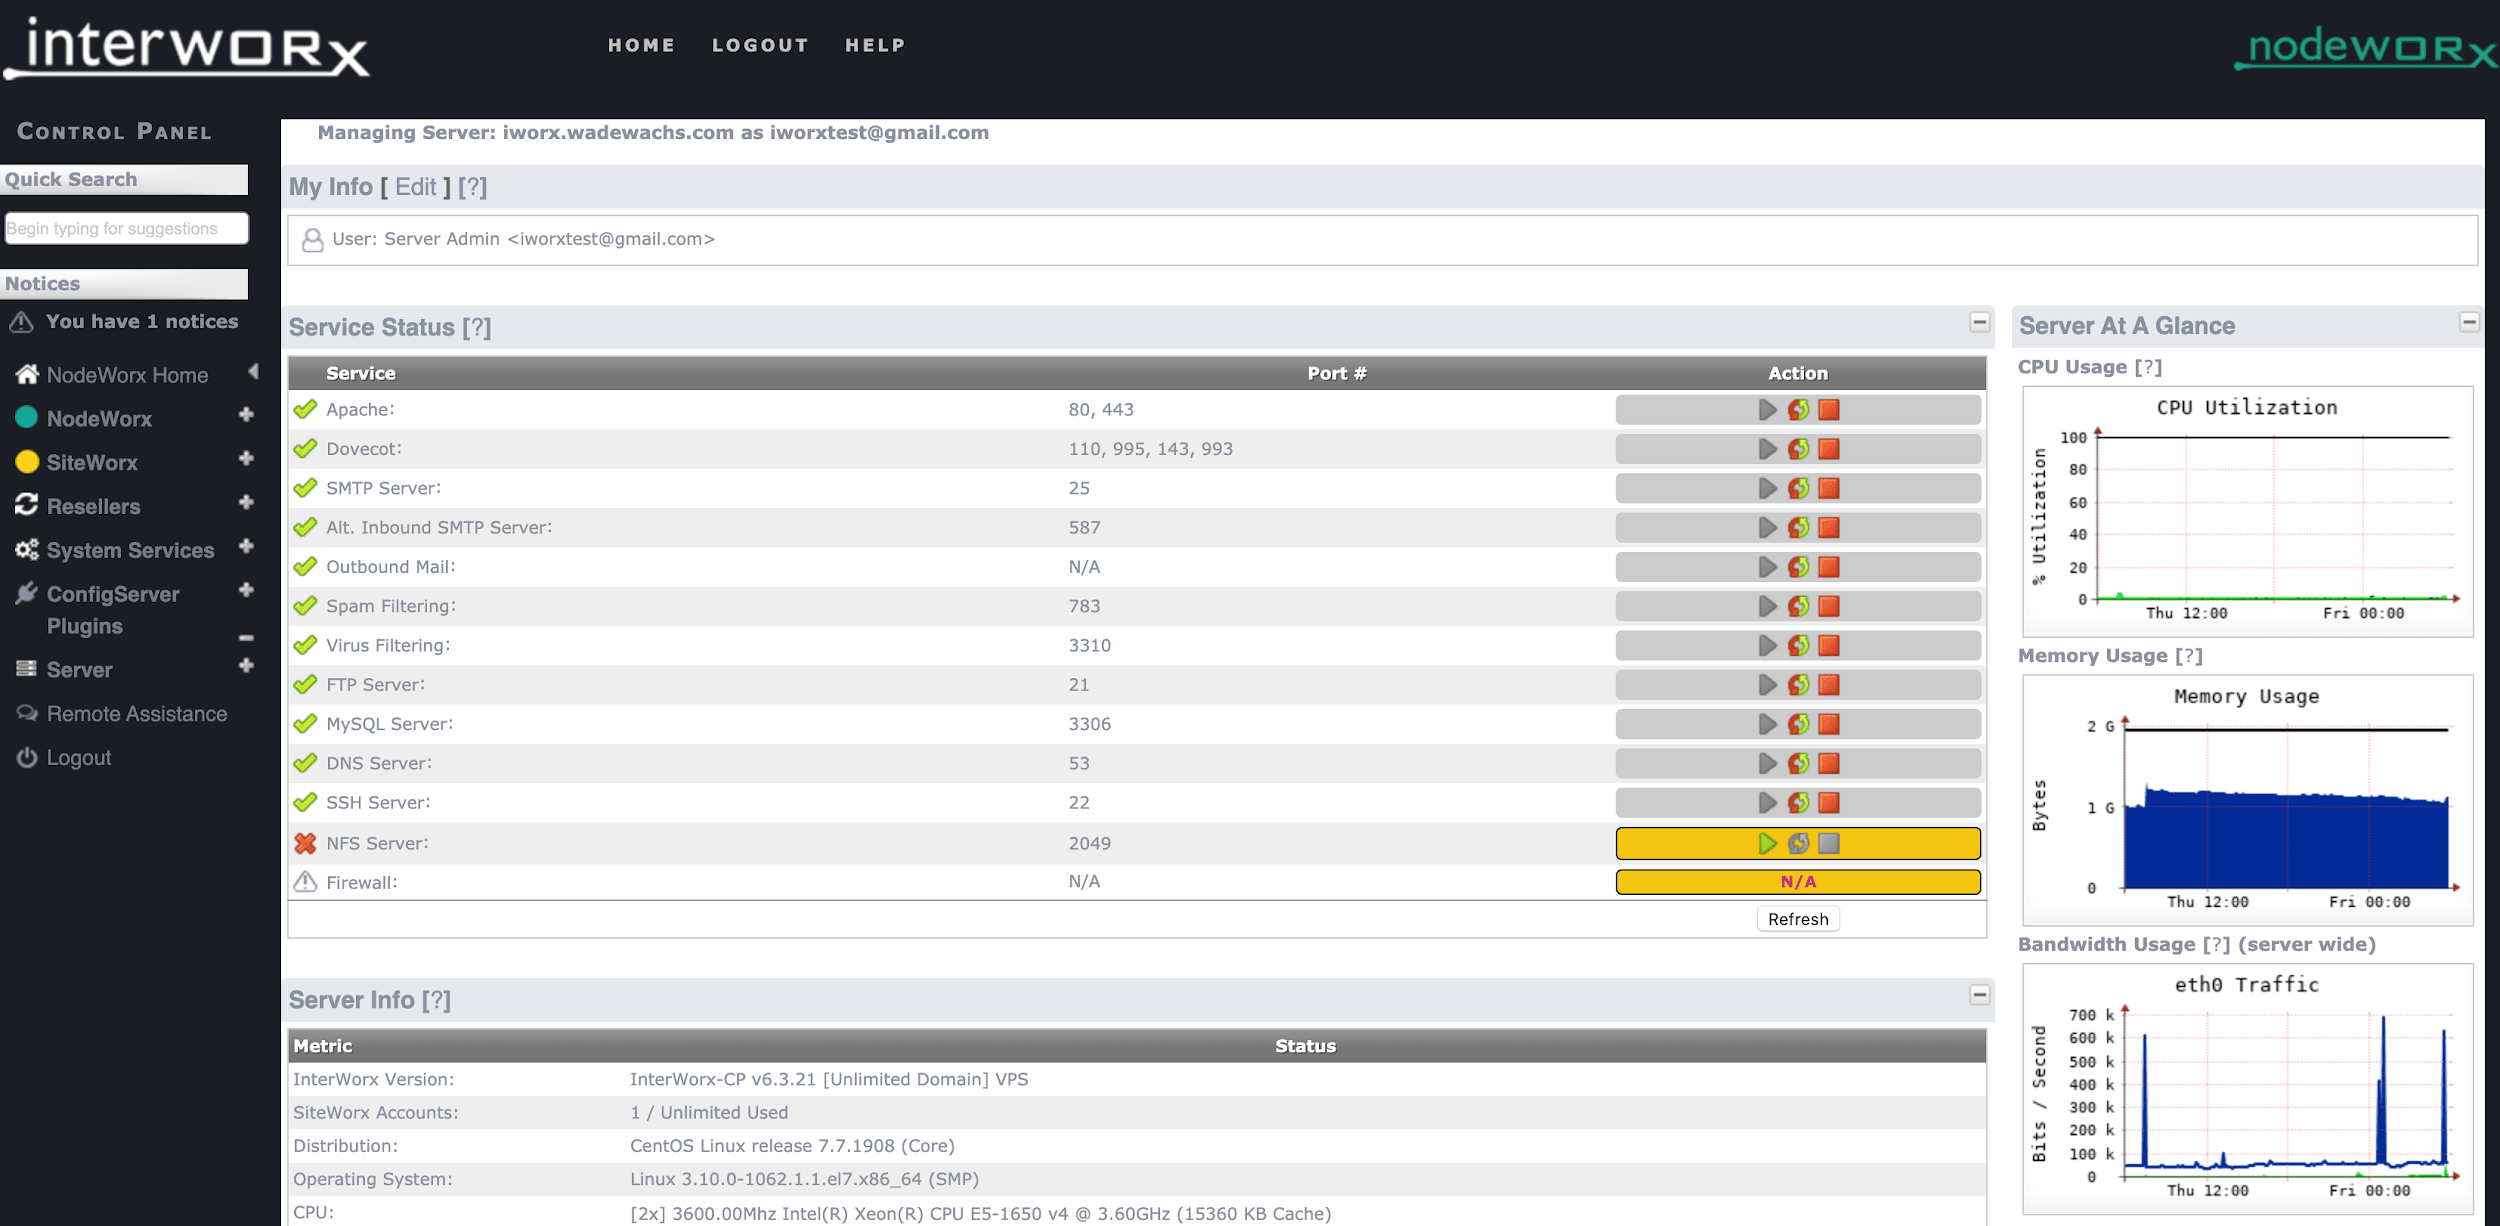
To view CPU utilization within the InterWorx control panel, you will typically access the server-level management interface, NodeWorx.
Primary Method: System Graphs
Follow these general steps:
- Log in to your NodeWorx control panel.
- In the main menu, locate and click on System Services.
- Under the System Services section, select System Graphs.
- Within this area, you will find various server performance metrics. Look for graphs or data specifically labeled for CPU Usage or CPU Load. These are often displayed over different time periods (e.g., hourly, daily, weekly, monthly).
Alternative: Server Health or Status Section
Depending on your InterWorx version or specific configuration, CPU information might also be present in a section dedicated to overall server health:
- Navigate to NodeWorx -> Server.
- Look for sub-sections like System Health, Server Status, or Resource Usage.
These sections often provide a snapshot of current or recent CPU metrics alongside other vital server statistics.
The exact naming and location can vary slightly between InterWorx versions, but these are the most common pathways to find CPU performance data directly within the control panel.