Core Debugging Tools
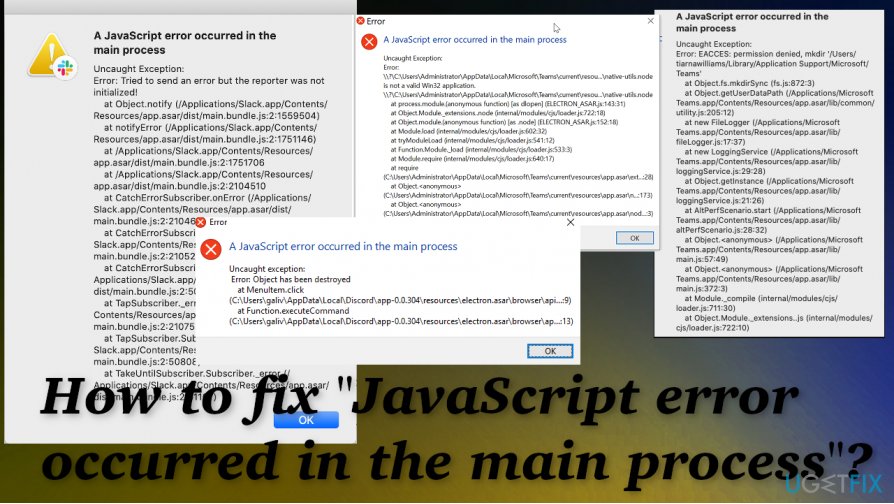
For rapid resolution of JavaScript errors in the main process, leverage built-in and specialized debuggers. * Inspector enables real-time breakpoints and stack tracing through Chrome DevTools integration. Electron apps benefit from the same approach for inspecting main process execution. Command-line debugging with node --inspect accelerates issue isolation without UI overhead.
Error Tracking Solutions
Implement robust logging and monitoring to catch errors early. Tools like Winston or Bunyan provide structured logging for easy filtering in terminal or files. For production, services such as Sentry or Rollbar automatically capture and alert on exceptions. Set alerts for critical errors to enable swift remediation.
Preventative Measures
Adopt proactive strategies to minimize errors. Utilize linting tools like ESLint for static analysis, flagging syntax issues before runtime. Integrate testing frameworks such as Jest or Mocha to run automated unit and integration tests. Regularly update dependencies and use process managers like PM2 for reliable restarts.

Workflow Optimization
- Isolate the error by reproducing it in a minimal environment.
- Analyze stack traces and logs to pinpoint root cause.
- Leverage breakpoints and step-through debugging in Chrome DevTools.
- Test fixes incrementally to avoid regressions.
This focused approach ensures rapid error resolution and system stability.


